Agriculture, forestry, and fishing, value added (% of GDP)
23.0% 2025
In 2025, the figure for Nigeria was 23.0%. Down 2.9 points from 25.9% in 2024.
Source: World Bank, World Development Indicators. Version 3. CC-BY-4.0.
Production, yields, land and food security. National figures for Nigeria; state figures are on each state's report as they are published.
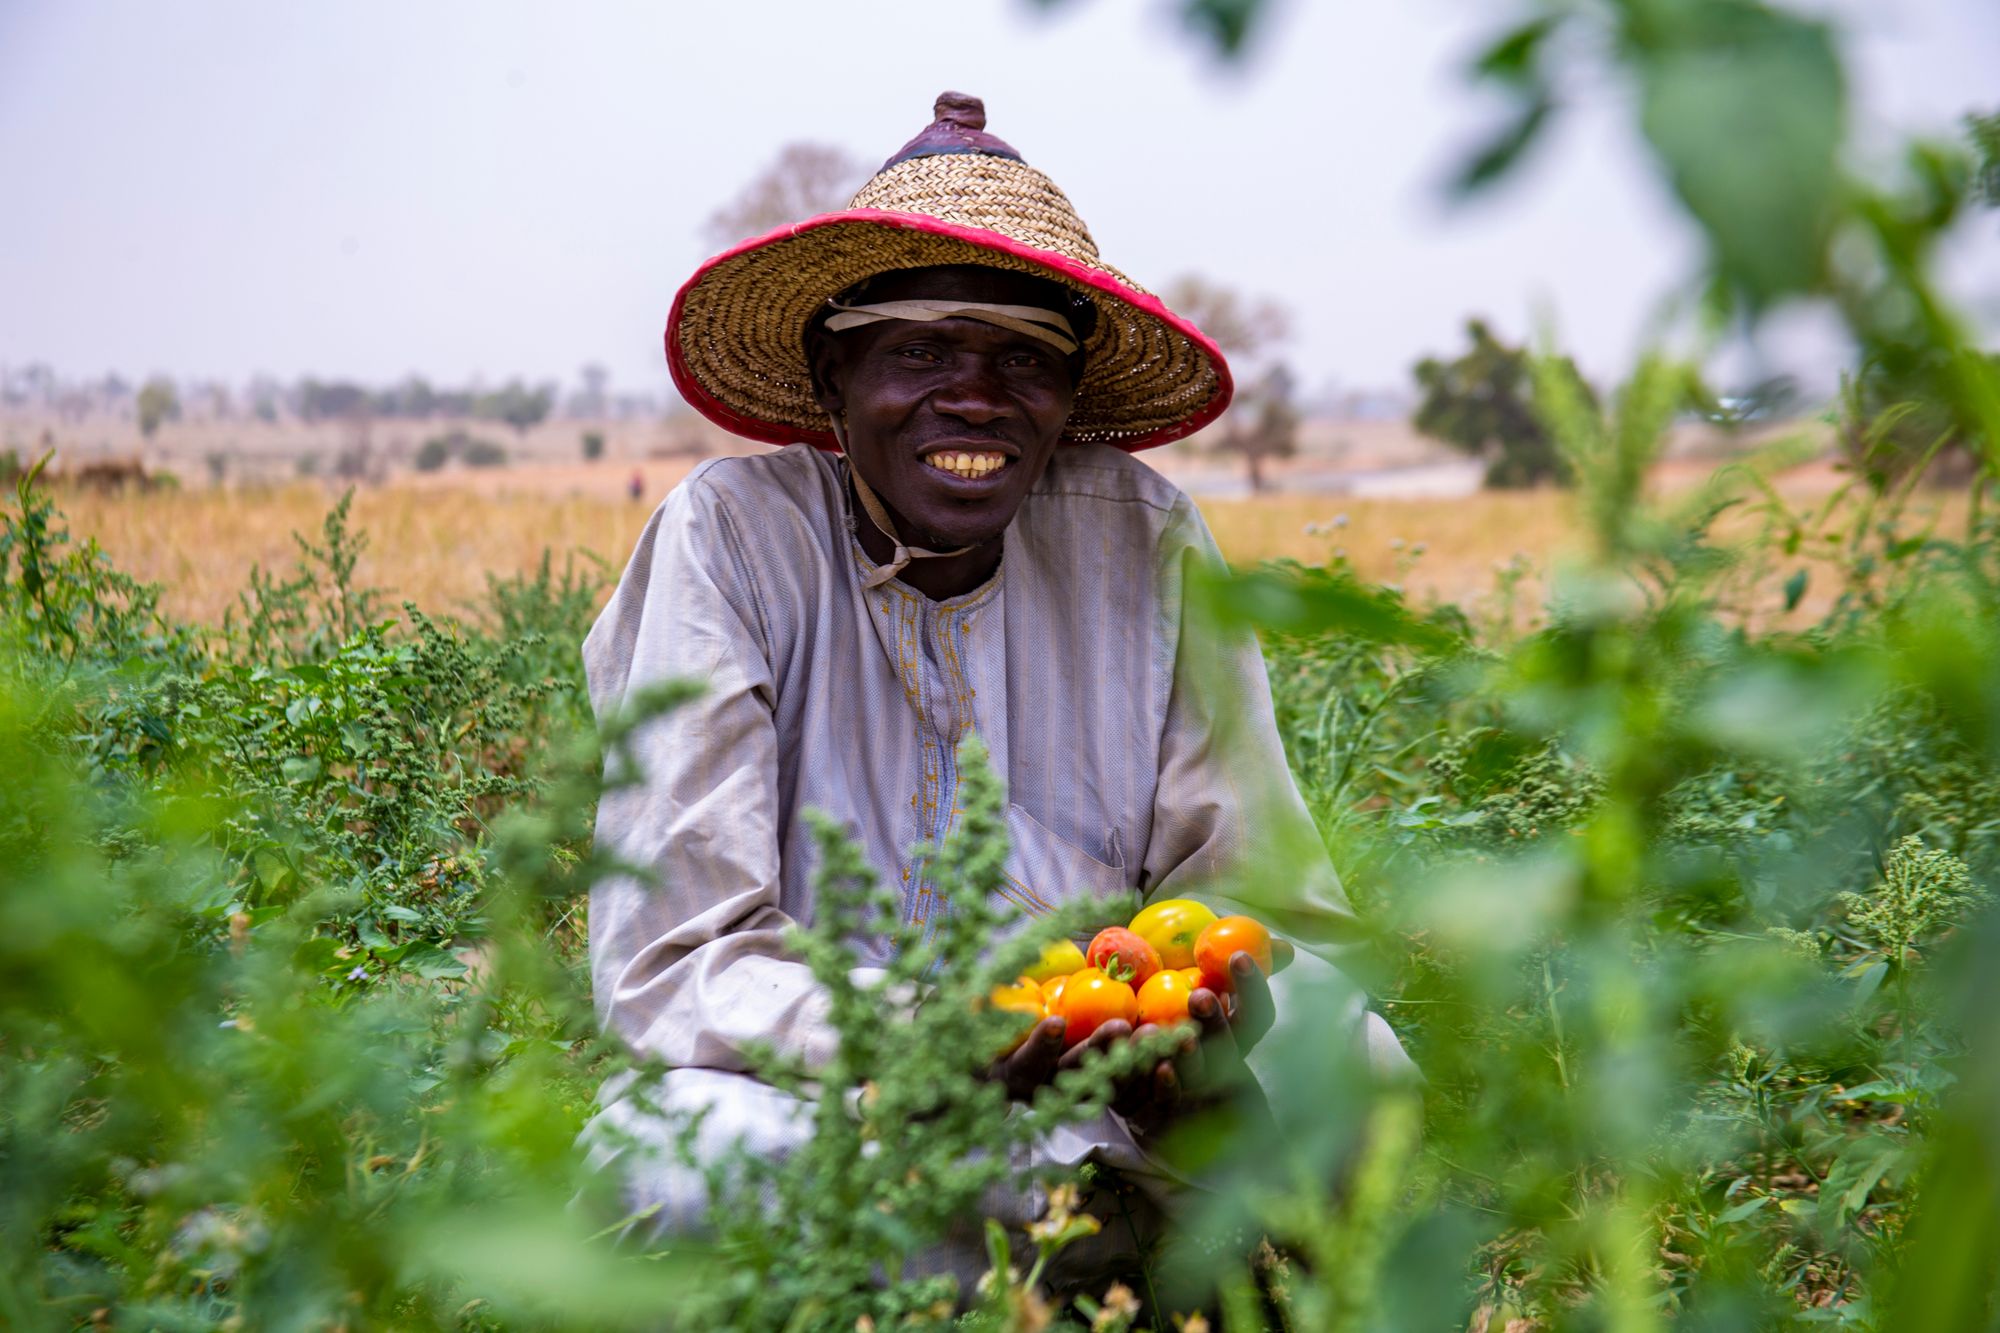 Photo: Achor David / Pexels
23.0% 2025
In 2025, the figure for Nigeria was 23.0%. Down 2.9 points from 25.9% in 2024.
Source: World Bank, World Development Indicators. Version 3. CC-BY-4.0.
33.5% 2025
In 2025, the figure for Nigeria was 33.5%. Down 0.6 points from 34.1% in 2024.
Source: World Bank, World Development Indicators. Version 3. CC-BY-4.0.
40.8% 2024
In 2024, the figure for Nigeria was 40.8%. Unchanged from 2023.
Source: World Bank, World Development Indicators. Version 3. CC-BY-4.0.
1,558 kg per hectare 2024
In 2024, the figure for Nigeria was 1,558 kg per hectare. Up 0.6% from 1,549 kg per hectare in 2023.
Source: World Bank, World Development Indicators. Version 3. CC-BY-4.0.
122.7 2024
In 2024, the figure for Nigeria was 122.7. Up 1.6% from 120.7 in 2023.
Source: World Bank, World Development Indicators. Version 3. CC-BY-4.0.
22.2% 2024
In 2024, the figure for Nigeria was 22.2%. Up 1.4 points from 20.8% in 2023.
Source: World Bank, World Development Indicators. Version 3. CC-BY-4.0.
Select a stage. Stage 4 of 8.
61.2M t of yam in 2022, the world's largest crop
Planned for this stage: Output of 12 crops by year and state.
Source: FAO via FAOSTAT, 2022