Forest area (% of land area)
18.9% 2024
In 2024, the figure for Nigeria was 18.9%. Down 0.1 points from 19.1% in 2023.
Source: World Bank, World Development Indicators. Version 3. CC-BY-4.0.
Rainfall, temperature, forests, emissions and risk. National figures for Nigeria; state figures are on each state's report as they are published.
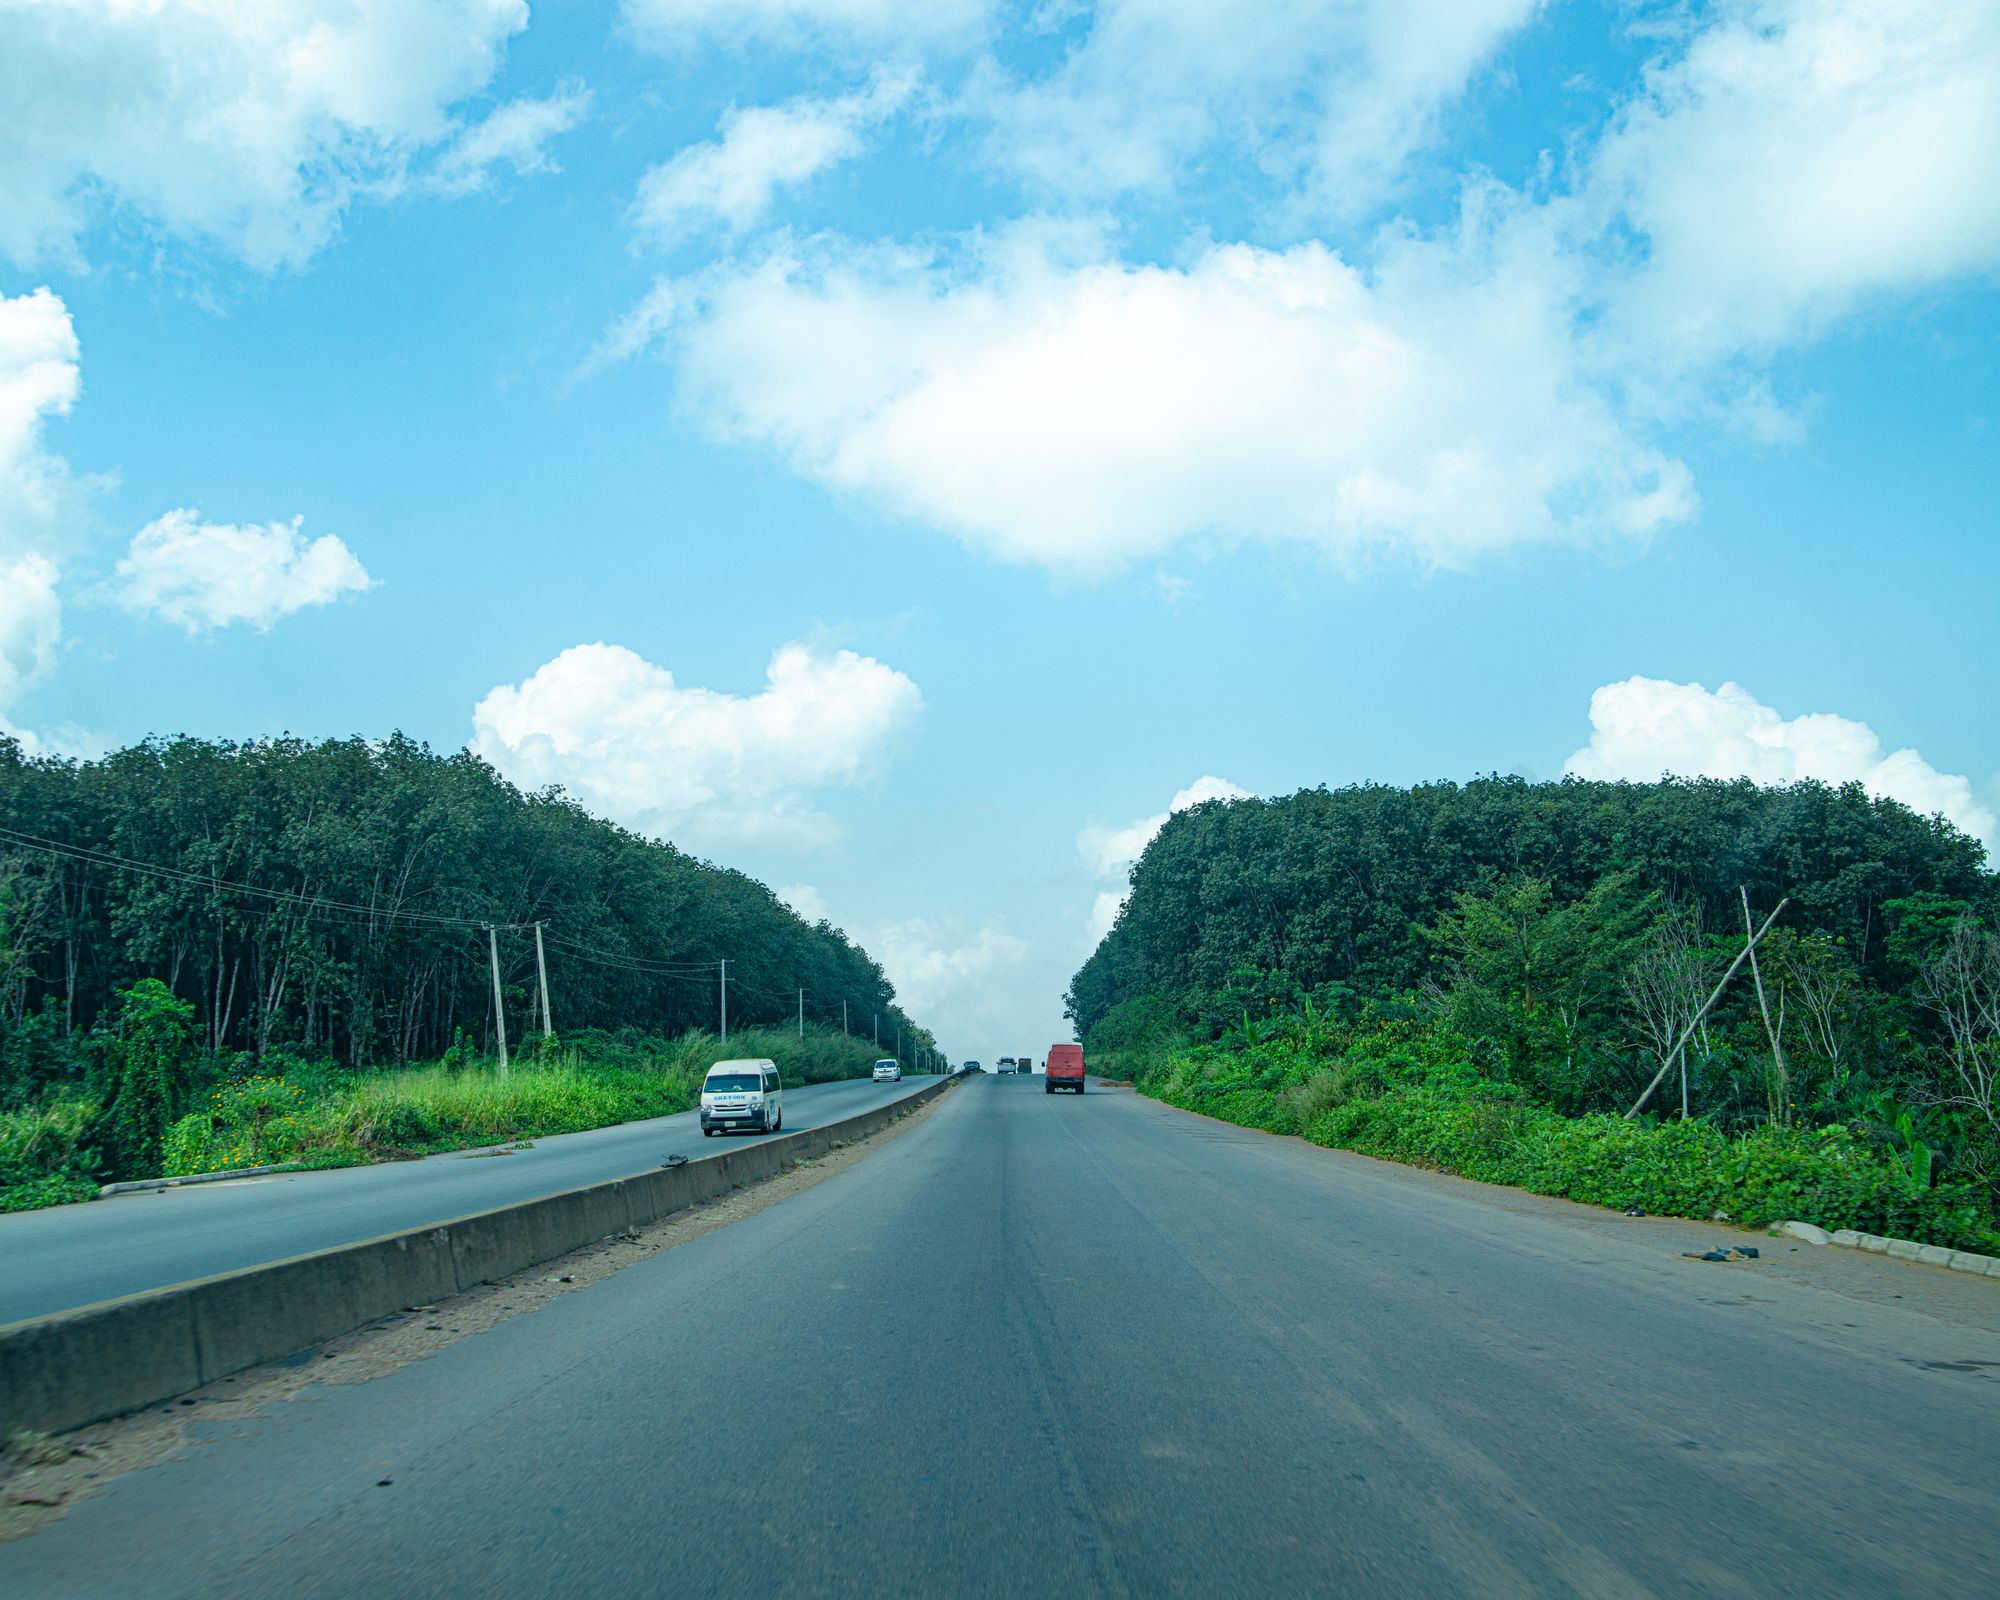 Photo: David Iloba / Pexels
18.9% 2024
In 2024, the figure for Nigeria was 18.9%. Down 0.1 points from 19.1% in 2023.
Source: World Bank, World Development Indicators. Version 3. CC-BY-4.0.
350.6 Mt CO₂e 2024
In 2024, the figure for Nigeria was 350.6 Mt CO₂e. Up 3.8% from 337.8 Mt CO₂e in 2023.
Source: World Bank, World Development Indicators. Version 3. CC-BY-4.0.
65.7 µg/m³ 2023
In 2023, the figure for Nigeria was 65.7 µg/m³. Down 6.9% from 70.6 µg/m³ in 2022.
Source: World Bank, World Development Indicators. Version 3. CC-BY-4.0.