Literacy rate, adult total (% of people ages 15 and above)
70.4% 2024
In 2024, the figure for Nigeria was 70.4%. Up 7.3 points from 63.2% in 2021.
Source: World Bank, World Development Indicators. Version 3. CC-BY-4.0.
Enrolment, literacy, completion and examinations. National figures for Nigeria; state figures are on each state's report as they are published.
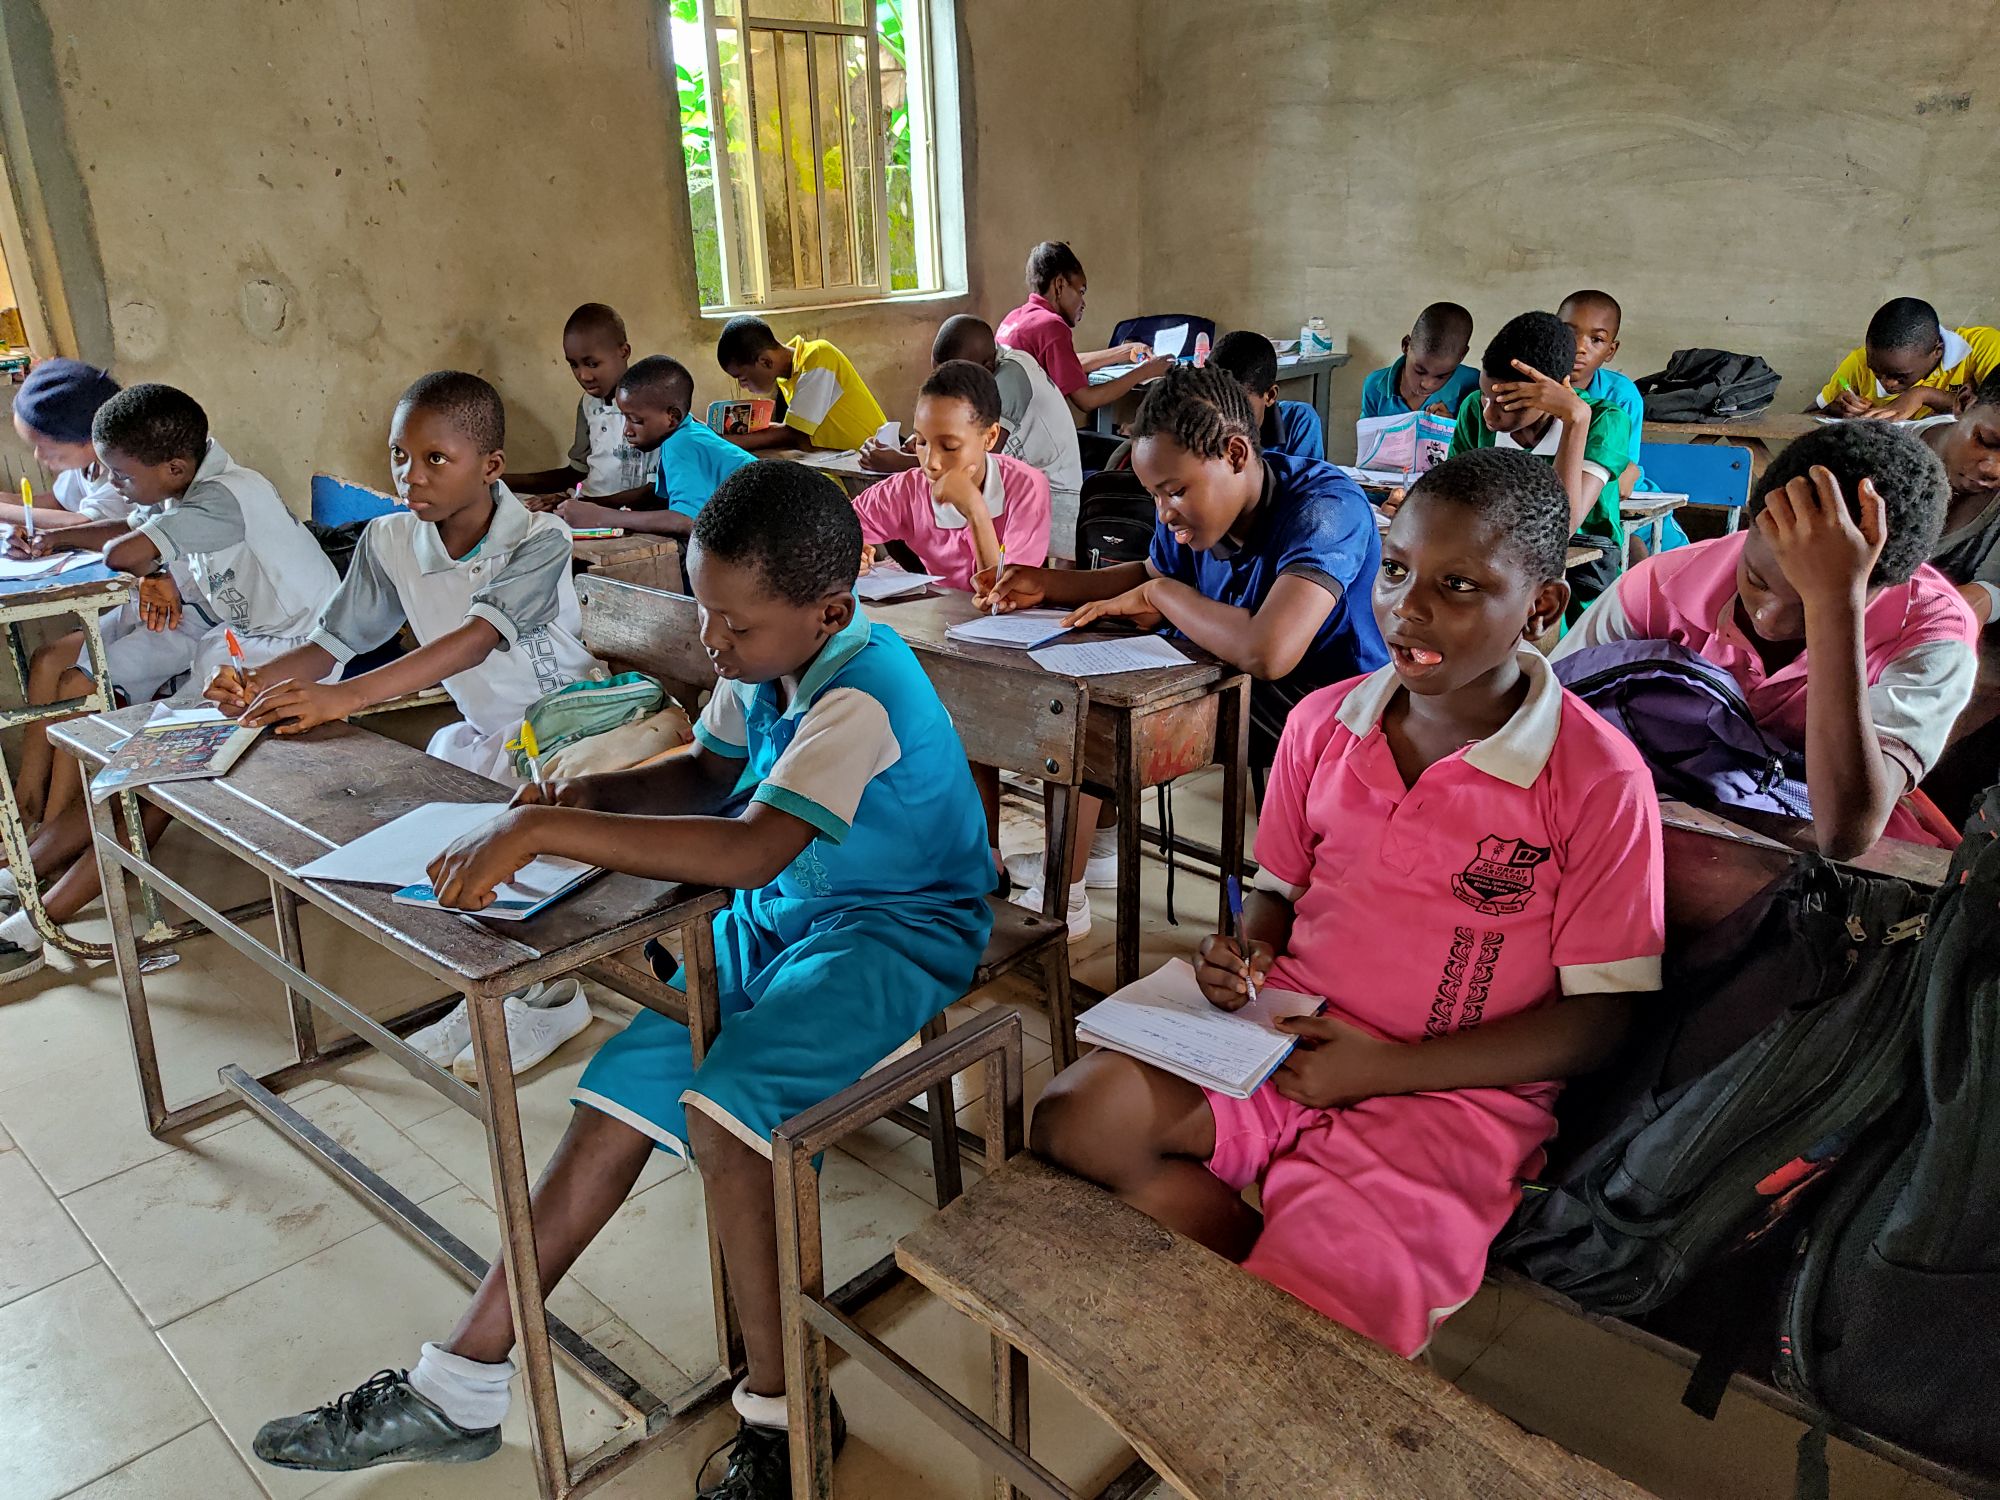 Photo: Erique Erufu Onojoserio / Pexels
70.4% 2024
In 2024, the figure for Nigeria was 70.4%. Up 7.3 points from 63.2% in 2021.
Source: World Bank, World Development Indicators. Version 3. CC-BY-4.0.
72.4% 2024
In 2024, the figure for Nigeria was 72.4%. Up 0.4 points from 72.0% in 2018. Across states in 2024, it ranged from 34.8% in Kebbi to 99.0% in Osun.
Source: The DHS Program (ICF), Nigeria Demographic and Health Survey (DHS Program API) (NG2024DHS). Version 3. DHS-TERMS.
57.2% 2024
In 2024, the figure for Nigeria was 57.2%. Up 4.1 points from 53.1% in 2018. Across states in 2024, it ranged from 10.7% in Kebbi to 93.5% in Abia.
Source: The DHS Program (ICF), Nigeria Demographic and Health Survey (DHS Program API) (NG2024DHS). Version 3. DHS-TERMS.
70.2% 2010
In 2010, the figure for Nigeria was 70.2%. Up 0.3 points from 69.9% in 2009.
Source: World Bank, World Development Indicators. Version 3. CC-BY-4.0.
89.6% 2023
In 2023, the figure for Nigeria was 89.6%. Up 5.8 points from 83.8% in 2021.
Source: World Bank, World Development Indicators. Version 3. CC-BY-4.0.
46.9% 2023
In 2023, the figure for Nigeria was 46.9%. Up 1.4 points from 45.4% in 2021.
Source: World Bank, World Development Indicators. Version 3. CC-BY-4.0.
0.3% 2023
In 2023, the figure for Nigeria was 0.3%. Unchanged from 2022.
Source: World Bank, World Development Indicators. Version 3. CC-BY-4.0.